Part 4: SUPPLIER SCORECARDS: TRACK PERFORMANCE LIKE YOUR BUSINESS DEPENDS ON IT (BECAUSE IT DOES)
Discover the importance of supplier scorecards for tracking performance and making data-driven decisions to enhance supply chain resilience and save costs. **Summary of the Main Point:** The blog emphasizes the necessity of using supplier scorecards to track performance metrics such as on-time delivery, lead time accuracy, defect rate, communication responsiveness, price competitiveness, and order accuracy. This data-driven approach helps businesses identify underperforming suppliers, initiate corrective actions, and ultimately save costs and improve supply chain resilience.
Part 4 of 6 in our Supply Chain Resilience Series | Reading time: 6 minutes
The Supplier You Thought Was Great (Wasn't)
Tom has bought from the same hydraulic parts supplier for 6 years. Great relationship. Good pricing. Never had a "major" problem.
Then his CFO asked a simple question during budget review:
"What's our on-time delivery rate with this supplier?"
Tom's answer: "Pretty good. Maybe 90%?"
CFO: "Can you show me the data?"
Tom: "Uh... I don't track that."
So they spent 3 hours digging through emails and PO records.
The reality:
- On-time delivery: 67% (not 90%)
- Average delay when late: 11 days
- Quality issues: 14 in past year (Tom forgot about most)
- Price increases: 18% over 3 years (small increments he didn't notice)
Tom's "great supplier" was costing him $87,000 annually in:
- Stockouts from late deliveries
- Rush fees from alternate suppliers
- Quality issue returns and replacements
- Price creep (competitors were 12% cheaper)
The problem? Tom ran his business on feelings, not data.
The solution? Supplier scorecards. Monthly performance tracking. Facts instead of feelings.
Why Most Distributors Don't Track Supplier Performance
I've heard every excuse:
"I don't have time." Reality: 15 minutes per month per supplier. For your top 10 suppliers = 2.5 hours/month.
"Our suppliers are fine." Reality: You don't know if they're fine. You're guessing.
"We'll switch if there's a problem." Reality: By the time you notice the "problem," you've lost thousands in revenue.
"Relationships matter more than metrics." Reality: Good relationships are built on accountability, which requires measurement.
The truth: You manage what you measure. If you don't track supplier performance, you're flying blind.
What to Track: The 6 Critical Metrics
You don't need 50 metrics. You need 6.
Metric 1: On-Time Delivery Rate
What it measures: % of orders delivered by promised date
How to calculate:
On-time delivery rate = (Orders delivered on time ÷ Total orders) × 100 Example:
Last 3 months, Supplier A:
- Total orders: 15
- Delivered on promised date: 12
- Late deliveries: 3
- On-time rate: 80%
What "good" looks like:
- 95%+ = Excellent
- 90-94% = Good
- 85-89% = Acceptable
- Below 85% = Problem
Why it matters:
- Late deliveries = stockouts
- Stockouts = lost sales
- Lost sales = unhappy customers
Red flag: On-time rate trending down over time
Metric 2: Lead Time Accuracy
What it measures: How accurate is the supplier's promised lead time?
How to calculate:
Lead time variance = Actual lead time - Promised lead time Example:
Supplier B last 10 orders:
| Order | Promised | Actual | Variance |
|---|---|---|---|
| 1 | 14 days | 18 days | +4 days |
| 2 | 14 days | 14 days | 0 days |
| 3 | 14 days | 21 days | +7 days |
| 4 | 14 days | 16 days | +2 days |
| 5 | 14 days | 14 days | 0 days |
Average variance: +2.6 days
What "good" looks like:
- 0-2 days variance = Excellent (predictable)
- 2-5 days variance = Acceptable
- 5+ days variance = Problem (unreliable)
Why it matters:
- Predictability > speed
- Consistent 16-day lead time > variable 12-20 day lead time
- You can plan around consistent delays
- You can't plan around unpredictability
Pro tip: Calculate "effective lead time" (promised + average variance) for safety stock calculations
Metric 3: Quality/Defect Rate
What it measures: % of items received with quality issues
How to calculate:
Defect rate = (Defective units ÷ Total units received) × 100 Example:
Supplier C last quarter:
- Total units received: 10,000
- Defective/returned: 120
- Defect rate: 1.2%
What "good" looks like:
- Below 1% = Excellent
- 1-2% = Acceptable
- 2-5% = Problem
- Above 5% = Critical issue
Why it matters:
- Defects = returns
- Returns = wasted time and shipping costs
- High defect rate = unreliable supplier
Track both:
- Defect rate (%)
- Total quality issues (count)
Sometimes 1 major issue (entire batch bad) matters more than defect %.
Metric 4: Communication Responsiveness
What it measures: How fast does supplier respond to emails/calls?
How to track:
Average response time = Total response time ÷ Number of inquiries Example:
Supplier D last month:
- 8 emails sent
- Response times: 2hr, 24hr, 4hr, 48hr, 6hr, 3hr, 72hr, 8hr
- Average response time: 20.9 hours
What "good" looks like:
- Under 4 hours = Excellent
- 4-24 hours = Good
- 24-48 hours = Acceptable
- Over 48 hours = Problem
Why it matters:
- Fast communication = solve problems quickly
- Slow communication = small issues become big issues
- During crisis, you need responsive partners
Also track:
- Do they proactively notify delays?
- Or do you have to chase them for updates?
Metric 5: Price Competitiveness
What it measures: Is pricing competitive with market?
How to track:
Price variance = (Your price - Market average) ÷ Market average × 100 Example:
SKU-4729 pricing:
- Your supplier: $12.50/unit
- Market average (3 quotes): $11.80/unit
- Price variance: +5.9% (you're paying 6% more)
What "good" looks like:
- Within 5% of market = Competitive
- 5-10% above = Slightly high (relationship premium acceptable)
- 10%+ above = Too expensive
Why it matters:
- Relationship loyalty is good
- But 15% price premium is not
- Annual price review prevents "price creep"
Track:
- Annual price increases (acceptable: 3-5% matching inflation)
- Competitor pricing (get 2-3 quotes annually)
Metric 6: Overall Order Accuracy
What it measures: Did you get exactly what you ordered?
How to calculate:
Order accuracy = (Perfect orders ÷ Total orders) × 100 Perfect order = Correct items + Correct quantities + Correct packaging + On time
Example:
Supplier E last quarter:
- Total orders: 20
- Perfect orders: 16
- Issues: Wrong quantity (2), Wrong item (1), Damaged packaging (1)
- Order accuracy: 80%
What "good" looks like:
- 95%+ = Excellent
- 90-95% = Good
- 85-90% = Acceptable
- Below 85% = Problem
Why it matters:
- Wrong items = returns, delays, frustrated customers
- Each mistake costs time and money
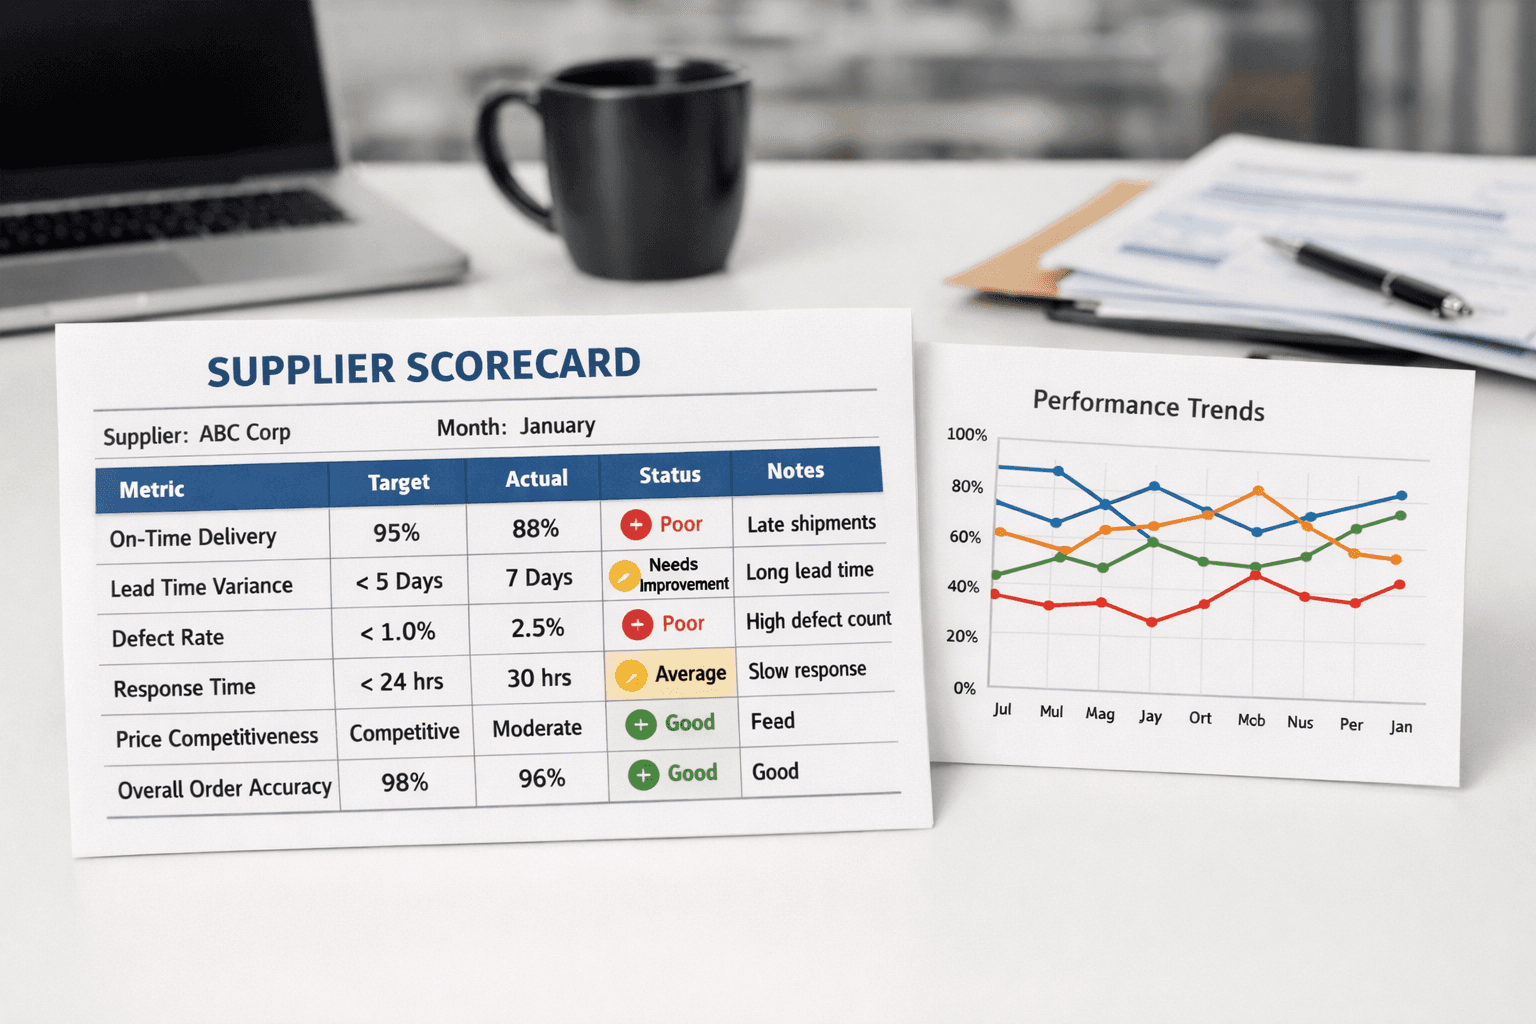
The Monthly Supplier Scorecard Template
Here's what Tom's scorecard looks like now (he learned his lesson):
Supplier: Acme Hydraulics | Month: February 2026
| Metric | Target | Actual | Status | Notes |
|---|---|---|---|---|
| On-time delivery | 95% | 87% | ⚠️ Warning | 2 orders 5+ days late |
| Lead time variance | <3 days | 4.2 days | ⚠️ Warning | Trending up |
| Defect rate | <1% | 1.2% | ⚠️ Warning | 1 batch issue (resolved) |
| Response time | <24hr | 18hr | ✅ Good | Improved from last month |
| Price competitiveness | Market | -5% | ✅ Good | Still competitive |
| Order accuracy | 95% | 90% | ⚠️ Warning | Wrong qty on 2 orders |
Overall Score: 72/100 (Warning - trending down)
Status: ⚠️ Schedule performance review call
Action items:
- Call supplier, discuss delivery delays
- Request improvement plan for order accuracy
- Review quality control process for defects
Three months later, after the conversation:
| Metric | Target | Actual | Status |
|---|---|---|---|
| On-time delivery | 95% | 94% | ✅ Good |
| Lead time variance | <3 days | 2.1 days | ✅ Excellent |
| Defect rate | <1% | 0.6% | ✅ Excellent |
| Response time | <24hr | 12hr | ✅ Excellent |
| Price competitiveness | Market | -5% | ✅ Good |
| Order accuracy | 95% | 97% | ✅ Excellent |
Overall Score: 94/100 (Excellent)
What changed? Tom had data. He had the conversation. Supplier improved.
Without scorecards? Tom never would have noticed the decline.
Real-World Example: Plumbing Distributor Saves $94,000
Company: Plumbing supply distributor, $12M revenue, 47 active suppliers
Before scorecards:
- No performance tracking
- Reactive approach (firefight problems as they occur)
- Gut-feel supplier decisions
After implementing monthly scorecards:
What they discovered:
Problem suppliers identified:
- 8 suppliers below 85% on-time delivery
- 3 suppliers consistently 2+ weeks late
- 1 supplier with 23% defect rate (!!!)
- 5 suppliers not competitive on pricing
Actions taken:
Immediate (Month 1):
- Stopped ordering from 23% defect supplier
- Saved $18,000 in returns and rework
Short-term (Months 2-3):
- Gave 90-day improvement notice to 3 chronically late suppliers
- 2 improved, 1 didn't (replaced them)
- Negotiated better pricing with 5 expensive suppliers (saved $31,000/year)
Long-term (Months 4-6):
- Shifted volume to top-performing suppliers (above 95% on-time)
- Reduced supplier count: 47 → 32 (focused on best partners)
- Established quarterly performance reviews
Results after 12 months:
Performance improvements:
- Average on-time delivery: 78% → 94%
- Stockouts: -67%
- Customer complaints about product issues: -52%
Cost savings:
- Emergency rush orders: -$87,000 annually
- Quality issue returns: -$23,000 annually
- Better pricing negotiations: -$31,000 annually
- Total savings: $141,000
Time investment: 3 hours/month to review scorecards
ROI: The scorecards paid for themselves in the first month.
How to Implement Supplier Scorecards This Month
Don't try to score all 47 suppliers at once.
Week 1: Start with Top 5 Suppliers
Pick your 5 biggest suppliers by:
- Spend (highest dollar volume)
- Or criticality (most important products)
- Or problem frequency (most issues)
Just 5. That's it.
Week 2: Gather Historical Data
For each of 5 suppliers, pull last 3 months:
- PO dates vs receipt dates (on-time %)
- Promised lead time vs actual (variance)
- Quality issues logged (defect count)
- Email response times (communication)
Don't go back years. 3 months is enough to start.
Week 3: Create First Scorecards
Use template above. Enter data.
You'll immediately see:
- Which supplier is your best performer
- Which has problems you didn't notice
- Where to focus improvement efforts
Week 4: Take Action
For top performers (90+ score):
- Thank them
- Consider giving more volume
- Ask for preferential pricing
For problem suppliers (below 75 score):
- Schedule call
- Share specific data (not feelings)
- Request improvement plan
- Set 90-day review
For medium performers (75-89 score):
- Monitor closely
- Look for trends (improving or declining?)
Month 2+: Expand and Refine
- Add 5 more suppliers each month
- After 6 months, you're tracking top 30 suppliers
- Review monthly, deep dive quarterly
The Conversation That Changes Everything
Before scorecards:
You: "Your deliveries have been late lately." Supplier: "Really? I don't think so. Business is busy for everyone." You: "Well, it feels like it." Supplier: "We'll try to do better."
Nothing changes.
After scorecards:
You: "Your on-time delivery rate is 73% over the last 3 months. That's below our 90% threshold."
Supplier: "Really? I didn't realize it was that bad."
You: "Here's the data. 12 orders placed, only 9 arrived on promised date. Average delay is 8 days when late."
Supplier: "Okay, I see it. What do you need?"
You: "We need 90%+ on-time delivery within 90 days, or we'll need to shift volume to our backup supplier who's at 94%."
Supplier: "Understood. Let me look into our production scheduling. I'll have an improvement plan to you by Friday."
Result: Supplier takes you seriously. Performance improves.
Why it works: Data > feelings. Specific > vague. Accountable > promises.
Common Mistakes to Avoid
Mistake 1: Tracking Too Many Metrics
What people do:
- Create 20-metric scorecard
- Track everything imaginable
- Spend 10 hours/month on spreadsheets
Why it fails:
- Analysis paralysis
- Can't see the signal through noise
- Too time-consuming to maintain
Fix: Stick to 6 metrics. Add more only if needed for specific issues.
Mistake 2: Never Acting on the Data
What people do:
- Create beautiful scorecards
- Review monthly
- Do nothing about problem suppliers
Why it fails:
- Scorecards without action = wasted effort
- Suppliers learn there are no consequences
Fix: Set thresholds. When supplier drops below, take action (conversation, reduced volume, or replacement).
Mistake 3: Focusing Only on Price
What people do:
- Pick cheapest supplier
- Ignore on-time delivery, quality, communication
Why it fails:
- Cheapest supplier with 70% on-time delivery costs MORE than reliable supplier at +10% price
- Stockouts, rush fees, quality issues destroy savings
Fix: Total cost of ownership > unit price. Factor in reliability, quality, communication.
How AssetBlaze Automates Supplier Scorecards
Manual tracking works for 5-10 suppliers.
But what about 30-50 suppliers?
Inventory software calculates metrics automatically:
AssetBlaze tracks:
- Every PO (promised date vs actual receipt)
- On-time delivery % (calculated automatically)
- Lead time variance (tracked per supplier)
- Quality issues (logged when receiving inventory)
AssetBlaze alerts you:
- "Supplier A's on-time rate dropped to 82% (below threshold)"
- "Supplier B has been late 3 orders in a row"
- "Supplier C's lead time increased from 14 to 21 days"
You see dashboard:
- All suppliers ranked by performance
- Red/yellow/green status indicators
- Trending graphs (improving or declining?)
No spreadsheets. No manual calculations. Automatic tracking.
Ready to Stop Managing Suppliers by Gut Feel?
AssetBlaze tracks supplier performance automatically for every order.
Features:
- Automatic on-time delivery tracking
- Lead time variance calculation
- Quality issue logging
- Supplier comparison dashboard
- Alert when performance drops
Result: Make data-driven supplier decisions. Spot problems before they cost you revenue.
Over 2,500 distributors use AssetBlaze to manage supplier relationships.
Start Free → No credit card required. Setup in 5 minutes.
Continue the Series
Previous: The Safety Stock Calculator: How Much Inventory Should You Really Keep?


